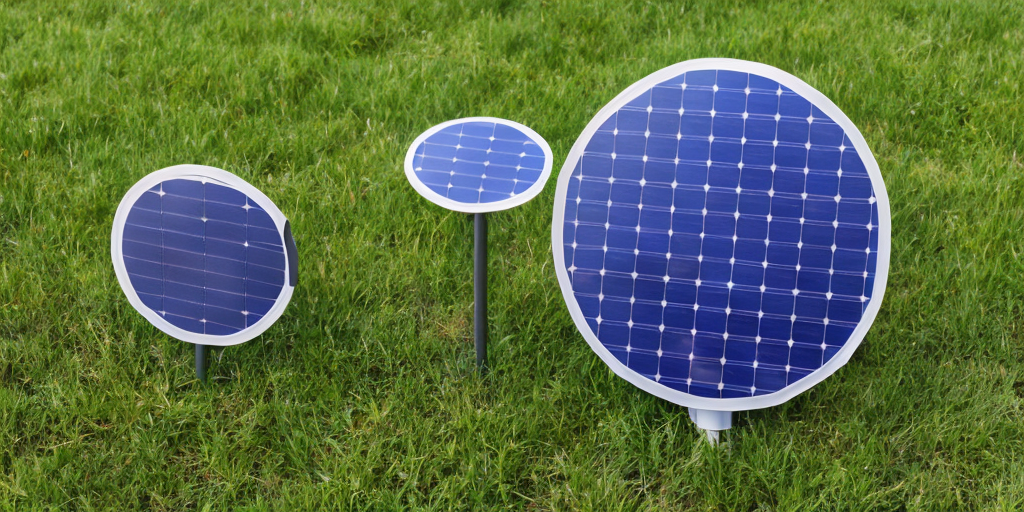
For several years I’ve used a Raspberry Pi Zero for sensors, camera & door motor control which opens & closes a chicken coop door. The Rpi & controller is 5v, the motor is 12v. This has been powered by around 50’ of extension cord, but the elements are beginning to weather the cord & we also need to move the chickens further away from our mains. I think it is time to implement solar. I aspire to assemble a PV, battery, & converter system which:
- Uses an off-the-shelf 12v PV panel (30w or so)
- Uses LiFePO cells for heat resiliency & stability
- Provides both 12v & 5v power
- Isn’t proprietary; uses standard, easily-sourced components… unless it meets specs perfectly & isn’t terribly expensive.
- Minimal power draw; at most 2 amps @ 12v for 10 seconds twice daily.
Does anyone have suggestions regarding this configuration, know of a post, blog, or video which does something similar, or is willing to ID components you’d recommend for this project?


Thanks for the reply. Do you have stats on how many watt hours you collect from the 100w panel in the Dec/Jan (assuming you’re in the northern hemisphere), and how those stats vary on overcast days vs sunny? I’m around 37°n and relatively sunny in the winter, except for a gloomy week here or there - an adequate battery buffer will be needed for those days, and the capacity can be shifted to ventilation fans in the summer.
While it does freeze here (occasionally down to 0° F) the battery will be inside the chicken coop where the temp has always remained above freezing. Initially my concern with lead acid was the risk of gassing into the birds’ airspace, which is why I’m drawn to the LiFePO4 chemistry. Victron does seem great for heavier(medium)-duty scenarios like sheds or RVs.
The pi is a zero, which pulls about 25-33% the current of a 3b, and I’ve been able to run it off a 10,000 mah battery bank for over 24 hours. It is beneficial to have it running continuously during daylight hours only, aside from logging weather lows, but I can’t think of a practical method to shut it down & bring it online automatically - at that point it’d probably make more sense to switch to an ESP32 device feeding data to a primary server inside the house.
I’m around 41°N (southern New England). I installed a Victron SmartSolar 30A just within the past week, so the stats I have are limited. The best I’ve seen so far was yesterday where I got 50Wh. Most other days it has been 40Wh. Today is a bit cloudy so I’ll try and update you on what I get.
Edit: I made a spreadsheet to sort of figure out what I can accomplish with 50Wh – and it’s not much! If the Pi draws 2.5 watts, the solar will only cover 20 hours not including any other electricity I want to use.
This time of year has the shortest days, so if I can bump it to 60+ Wh a day that will be better. My property also has the downside of a hill to the west, so it makes direct sunlight even shorter. I’ve already ordered a 2nd 100w panel from Harbor Freight so that will help.
You can model average insolation (and use that to extrapolate average harvest) by month using tools like PVwatts. Here’s a walkthrough.
Using Bowling Green, KY as an example since it’s on the 37th. 100w of flatmounted panel on an MPPT solar charge controller would average:
Solar wattage	100
Month	Daily Wh Avg
Jan	168
Feb	249
Mar	331
Apr	426
May	513
Jun	598
Jul	555
Aug	506
Sep	396
Oct	305
Nov	201
Dec	156
Average	367
Derate those yields by ~18% if using PWM. <-- rule of thumb, not gospel
if we are on the west coast instead, here’s Santa Cruz, California:
Solar wattage 100 Month Daily Wh Avg Jan 206 Feb 286 Mar 386 Apr 519 May 582 Jun 642 Jul 605 Aug 542 Sep 447 Oct 349 Nov 245 Dec 183 Average 416The figures above are daily averages, including normal weather patterns and are how we size our systems. But for the sake of curiosity/understanding, my observations have been that if my clear-day harvest is X then overcast is 0.6X, bright overcast is 0.7X and dark/rainy is 0.05-0.10X. Cloud-edge effect and other reflective phenomena can result in harvest >1X.
A battery warming solution could be implemented for $20 (warming pads, 12v temp controller).
Not OP but this is really neat. Thanks.
Over the past few days my system has been severely under performing in relation to these calculations. For January it says 290 Wh per day, but I’m only seeing 50. I do have a lot of trees, so probably some shading… maybe even a lot of shading.
Jan	290.3
Feb	392.9
Mar	387.1
Apr	400.0
May	387.1
Jun	400.0
Jul	419.4
Aug	387.1
Sep	400.0
Oct	322.6
Nov	300.0
Dec	290.3