
I’m pretty new to selfhosting, but one thing that I know to take seriously is log collection. Since there are a lot of different type of logs (kernel log, application logs, etc) and logs come in many different formats (binary, json, strings) - it’s no easy task to collect them centrally and look through them whenever neccessarly.
I’ve looked at grafana and tried the agent briefly, but it wasn’t as easy as I thought (and it might be a too big tool for my needs). So I thought to ask the linuxlemmy community to get some inspiration.
I’ve just started digging into it myself ! Here’s my current setup (I’ll see how it scales in the long term):
I run OpenBSD on all my servers, and configure all the services to log via syslog.
Then I configuré syslog to send only those I care about (https, DNS, …) to a central telegraf instance, using the syslog protocol (RFC3164).
On this collector, telegraf gets all these logs and parse them using custom grok patterns I’m currently building, to make sense out of every log line it receives. The parsed logs are in turns stored in Influxdb, running on the same host.
I then use Grafana to query InfluxDB and create dashboards out of these logs. Grafana can also display the logs “as-is” so you can search through them (it’s not ideal though as you simply search by regex from the full message, so it’s on par with grep at least).
This setup is fairly new and seem to work very well. Telegraf is also very low on resource usage for now. I’ll have to continue adding grok patterns and send more application logs to it to see how it handles the load. I do have a few questions still unanswered for now, but time will tell:
Q: Should I first collect via a central syslog before sending to telegraf ?
This would let syslog archive all logs in plain text, rotate and compress them. I would also only have a single host to configure for sending logs to telegraf. However this would eat up space, and could hide the original sending hostname for each log. I might try that someday.
Q: Should I run telegraf on each host ?
This would distribute the load of the grok parsing amongst all hosts, and then all telegraf processes will send directly to the central one for collection, or even directly into influxdb. I would also benefit from telegraf being install on each host to collect more data (CPU, network stats, …). However it makes the configuration more complex to handle.
Q: What is a good retention period ?
For now, influxDB doesn’t expire any data, as I don’t have much yet. In the long run, I should probably delete old data, but it’s hard to tell what is “old” in my case.
Q: Do I need an interface to read logs ?
I use this setup mostly for graphs, as grafana can make sense of fields like “http_verb”, “http_code” and such. However, it is much more practical for me to dig into the logs right on the server, in
/var/log. Having an interface like chronograf or graylog seems practical, but I feel like it’s overdoing it.Bonus: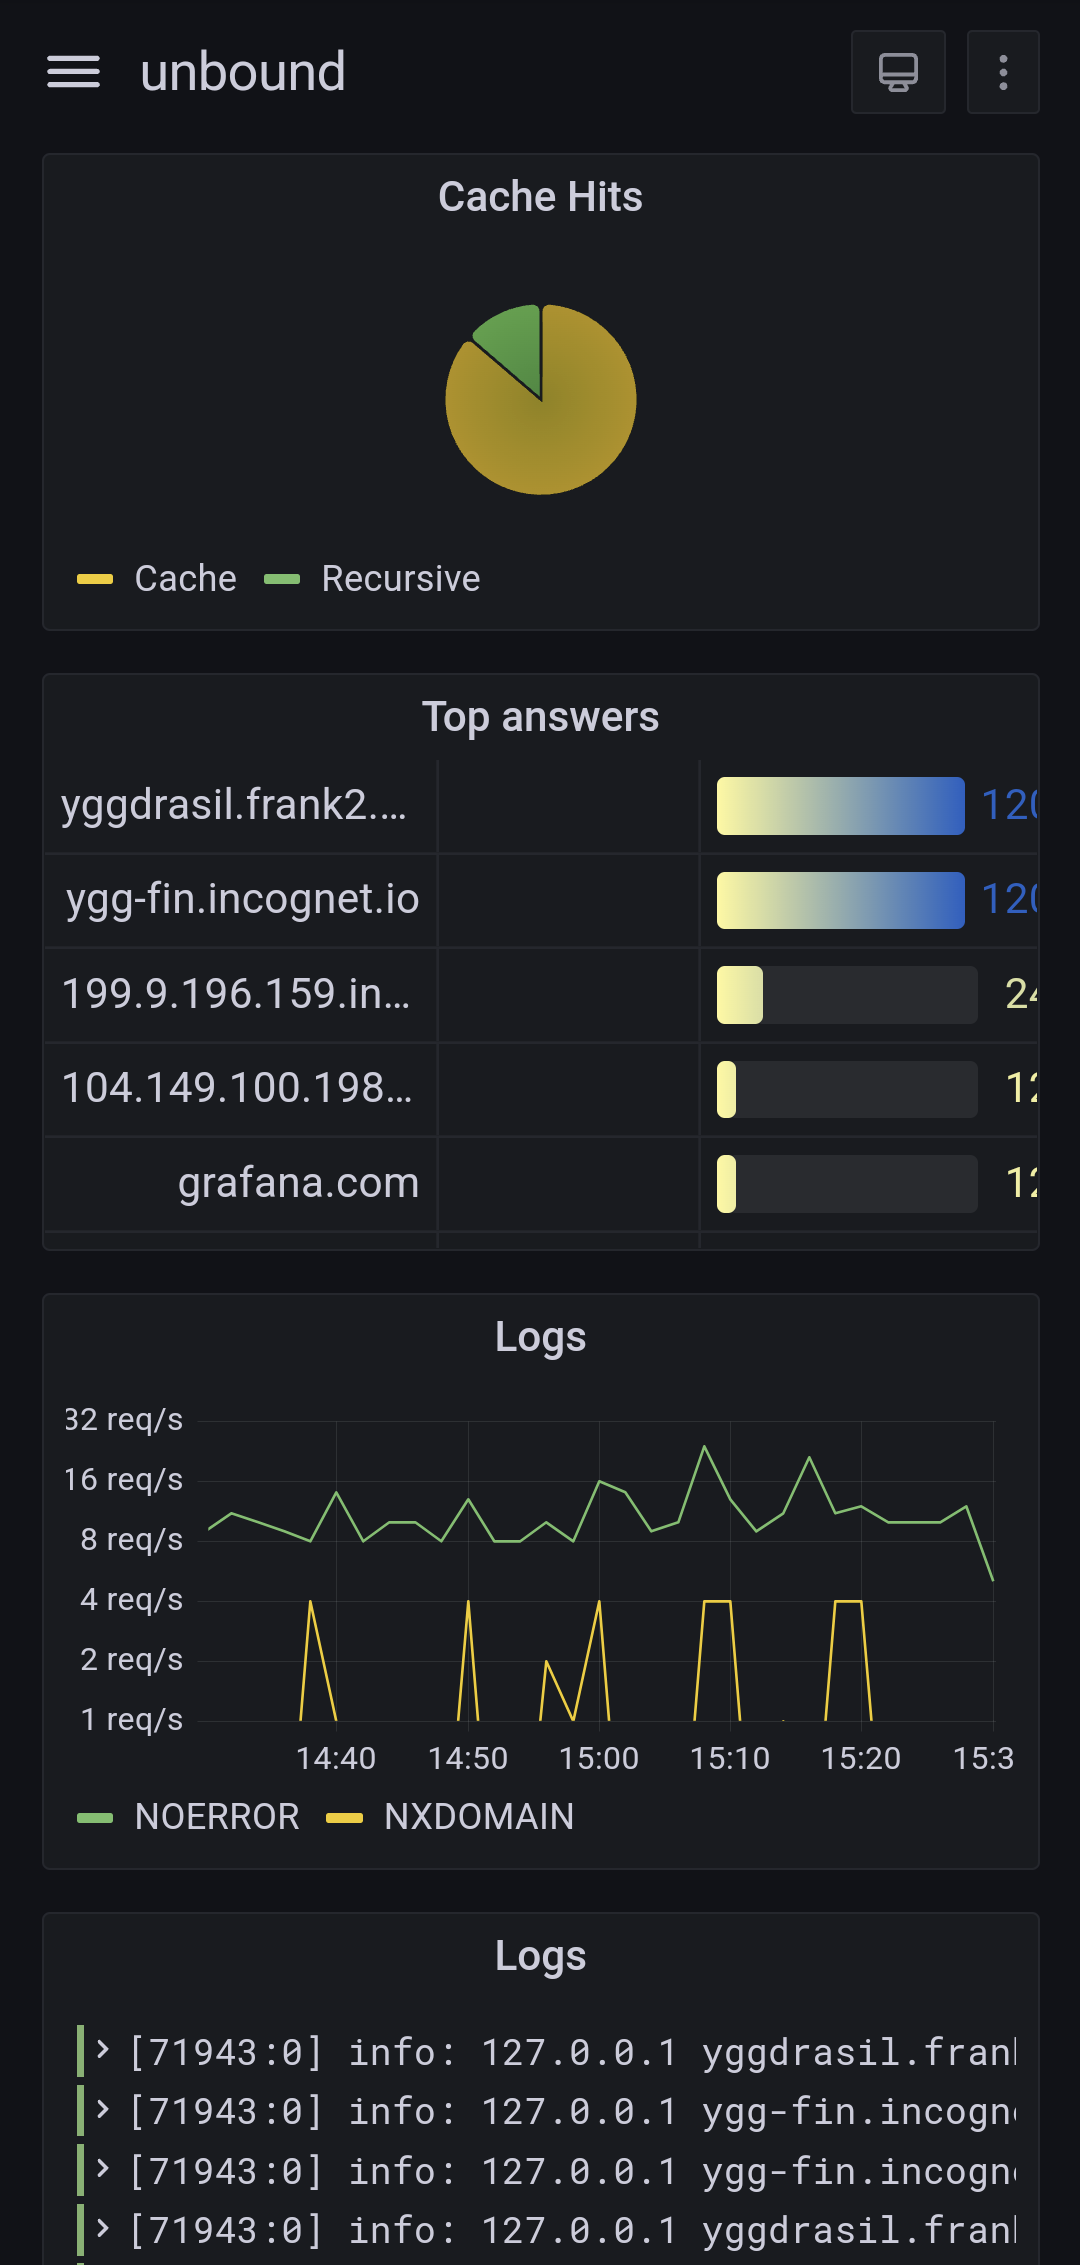
Nice! If you’d write a guide on your setup, I’d be all over it (along with others I’m sure) 😀
You’ll want to check this out: https://www.tumfatig.net/2022/ads-blocking-with-openbsd-unbound8/
That’s the post I took inspiration from for this setup. It does use collectd and custom awk scripts for log ingestion though, where I simply use telegraf.
How is the query performance of influxdb for searches in logs for text keywords?
Instead of Influxdb we are using Solr and it is pretty much instantaneous for searching and ordering no matter how large the data is (couple of hundred gigabytes of logs for now). We use it to provide true real-time search in logs for our support team.
It’s instant as well in my case, but I don’t have a huge amount of logs yet. I’m still figuring out this whole setup and what are it’s strength and weaknesses.
I’m using influxdb 1.8 though (which is old), because that’s the version shipped with openbsd repos. It crashes fairly often when you perform “illegal” operations, which is annoying. Like, the
DELETE FROMcommand only lets you use thetimefield in theWHEREclause. Using any other field would crash the DB. I might recompile it from scratch at some point because it lacks too many features from upstream. But for now, it does a decent job, and is really easy to setup (this was the killer feature for me).Is this for a homelab or commercial hosting?
It’s for my personal use. They’re mostly VPS though (I got a total of ~6 servers), except for that rock64 running in my home that I use as a local DNS and config center for the other servers.