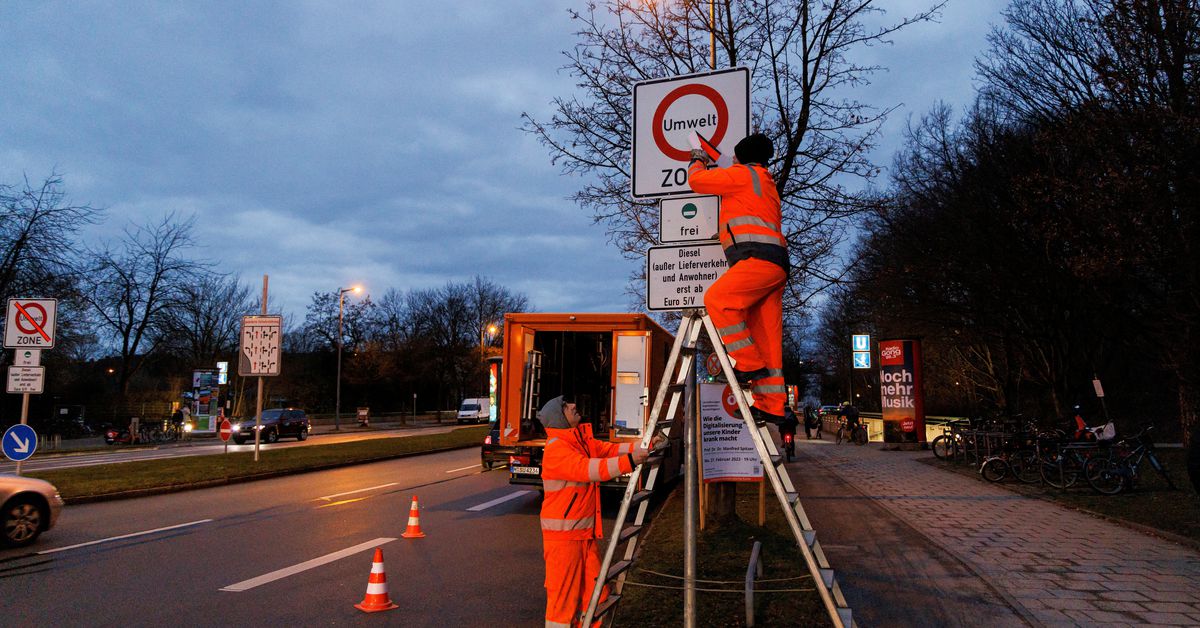
German goals to cut greenhouse emissions by 65% by 2030 are likely to be missed, meaning a longer-term net zero by a 2045 target is also in doubt, reports by government climate advisers and the Federal Environment Agency (UBA) show.
They literally have a graph showing their paris accord goal as of now, where they as of now, and a 1.5c goal. They and India are ahead.
Also
China’s emissions are nearing their peak, years ahead of when China’s government had pledged to reach that goal.
Every country has different pledge responsibilities it would be drastically unfair to ask more of developing countries to reduce at the same rate as non, especially taking into account the looting the west has done and the offshored emissions on their behalf.
When someone says “China has absolutely not met the Paris accord goals” and you respond “New York times reported China is ahead of pledges”, it creates the impression that you are correcting the former statement with a contradictory source. The source is not actually contradictory, however, because it explicitly affirms the original point.
They literally have a graph showing their paris accord goal as of now, where they as of now, and a 1.5c goal. They and India are ahead.
That is excellent. I’m very pleased to hear this. Perhaps you could share that graph next time instead?
EDIT: Content warning for the next reply in this comment chain: it contains a prank image featuring pig genitalia and feces. If you’re on desktop, the image is hidden within a collapsed spoiler toggle that you can choose to expand if curious. If you’re on mobile, please know that spoiler tags are not well supported in most apps yet, so this is your opportunity to stop scrolling if you happen to have issues with the described content.
It doesn’t seem much closer to the blue Paris Accord goal compared with any of the other graphs in the same article, as far as I can tell.
As for India, I don’t see how beating a goal of **+**25% emissions with +20% is any cause for celebration. I actually agree with you and the article when you say that they don’t need to be held to the same standard as fully developed economies, but in that case we probably shouldn’t be talking about them at all when it comes to meeting emissions reduction goals.


They literally have a graph showing their paris accord goal as of now, where they as of now, and a 1.5c goal. They and India are ahead.
Also
Every country has different pledge responsibilities it would be drastically unfair to ask more of developing countries to reduce at the same rate as non, especially taking into account the looting the west has done and the offshored emissions on their behalf.
I’m not anti-China. I’m just pro-clarity.
When someone says “China has absolutely not met the Paris accord goals” and you respond “New York times reported China is ahead of pledges”, it creates the impression that you are correcting the former statement with a contradictory source. The source is not actually contradictory, however, because it explicitly affirms the original point.
That is excellent. I’m very pleased to hear this. Perhaps you could share that graph next time instead?
EDIT: Content warning for the next reply in this comment chain: it contains a prank image featuring pig genitalia and feces. If you’re on desktop, the image is hidden within a collapsed spoiler toggle that you can choose to expand if curious. If you’re on mobile, please know that spoiler tags are not well supported in most apps yet, so this is your opportunity to stop scrolling if you happen to have issues with the described content.
It’s in the article.
spoiler
How is your reading comprehension so poor?
This graph, correct?
It doesn’t seem much closer to the blue Paris Accord goal compared with any of the other graphs in the same article, as far as I can tell.
As for India, I don’t see how beating a goal of **+**25% emissions with +20% is any cause for celebration. I actually agree with you and the article when you say that they don’t need to be held to the same standard as fully developed economies, but in that case we probably shouldn’t be talking about them at all when it comes to meeting emissions reduction goals.